The Problem
Drug development takes 10-15 years and costs billions. Everyone knows this. What fewer people talk about is why the timelines are so brutal — and it’s not mainly the science. It’s the data.
In early 2021, I was embedded with a global pharmaceutical company looking to compress clinical trial timelines. The brief sounded straightforward: use emerging technology to accelerate drug discovery. The reality was anything but. Their exploration phase alone — mapping data sources, identifying biological targets, evaluating chemical formulations, spotting patterns in biological responses — was a labyrinth of manual data interpretation and sequential processing. Each step waited on the last. Promising compounds sat in queues while teams navigated spreadsheets and siloed databases.
The real problem wasn’t the absence of data. It was the opposite. Data was everywhere — scattered across internal operational systems, analytical databases, external partnerships, and purchased datasets — all using different schemas, proprietary formats, and zero standardization. Nobody had a unified picture. And without a unified picture, you can’t run the kind of cross-domain analysis that separates a decade-long drug pipeline from a two-year one. COVID had just made the urgency visceral: the world watched in real time what happens when drug development moves at its traditional pace.
The Approach
I started where I always start: understanding the problem space and connected systems before proposing solutions. Not the technology system — the human-data system. Richard Feynman captures this instinct perfectly in Six Easy Pieces: before you can solve a problem, you need to understand what’s actually happening, not what you assume is happening. How did information actually flow through the organization? Where did it get stuck? What decisions were being made on incomplete data, and what was the cost of those gaps?
We ran a data discovery exercise — a structured collaborative activity to map the data landscape: what datasets existed, how they connected to each other, where they sat (cloud or on-prem, and on what platform), and how they were currently used. Think of it as building a basic terrain map before the game begins. We didn’t go too deep, for two reasons. First, COVID restricted travel and in-person evaluation. Second, we pivoted our focus toward understanding the business context — what problem were they actually trying to solve, and why now?
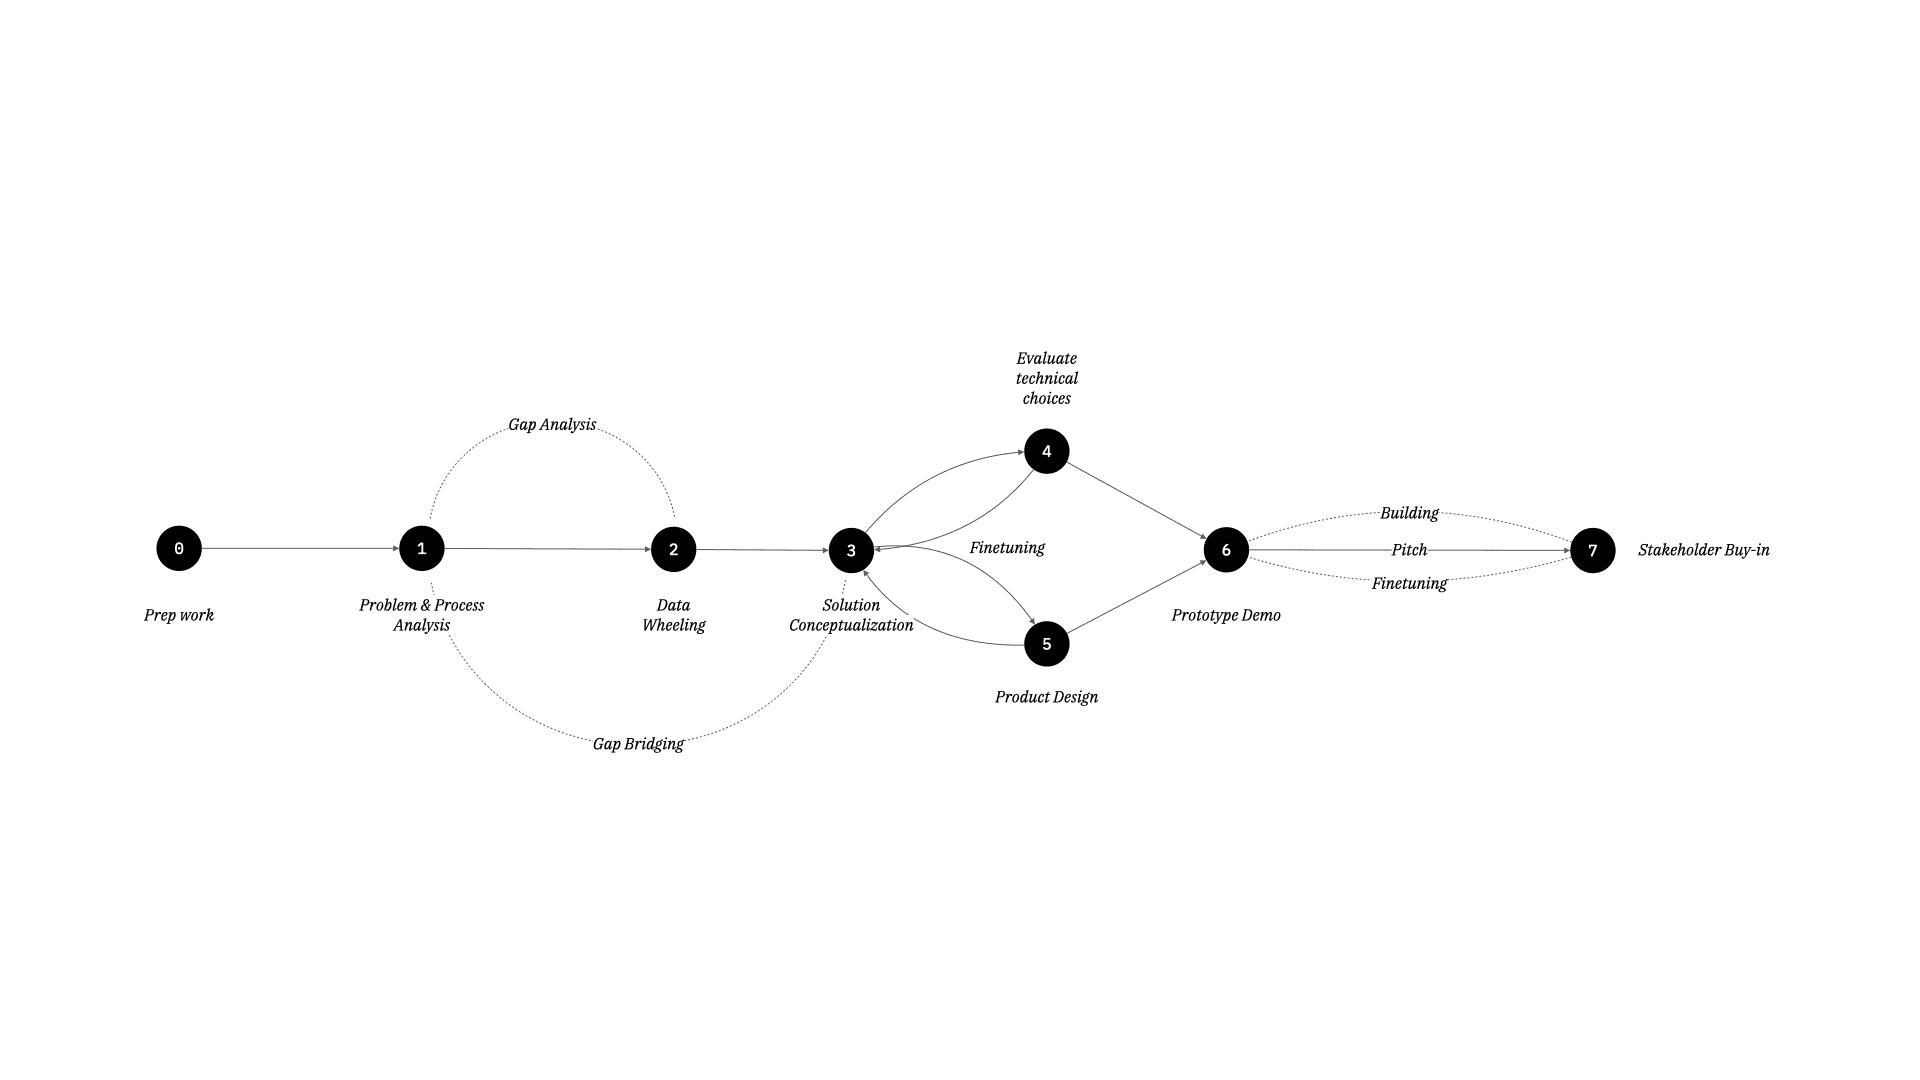
The insight from problem space understanding shaped the product concept: the problem wasn’t “we need AI” — it was “we need our data to help us reduce expensive timelines.” Digital twins and machine learning were the mechanism, but the real design challenge was making the pharmaceutical data platform architecture legible to humans for usage and adoption. I used thin-slicing — carving an ambitious vision into the smallest viable piece that could demonstrate value — to define a first slice: a cloud-based platform that would ingest, harmonize, and visualize data from disparate sources, then layer digital twin simulations on top.
The technology choices followed from the problem: cloud-native for distributed team access, ML models for pattern detection across merged datasets, NLP for parsing unstructured data from research papers and clinical reports. Every technical decision was grounded in a specific user workflow bottleneck, not in what was fashionable.
What We Built
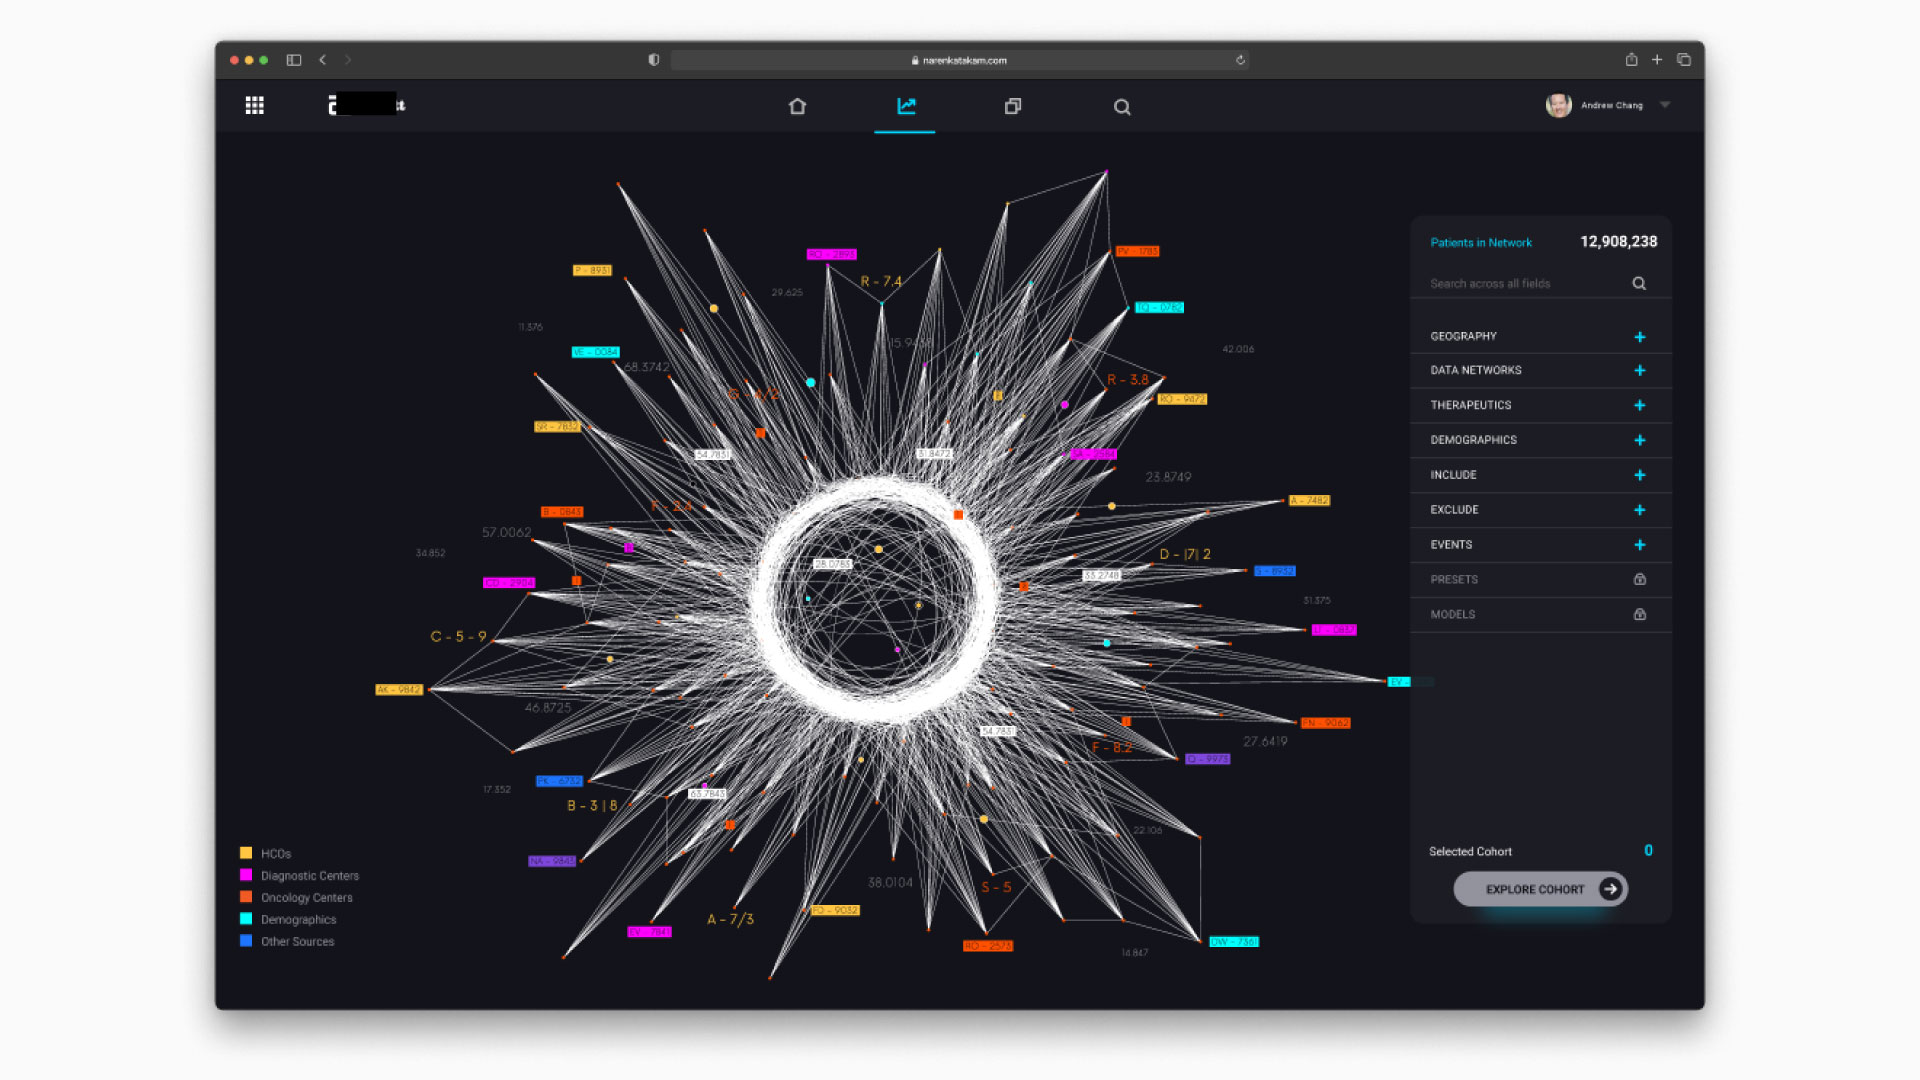
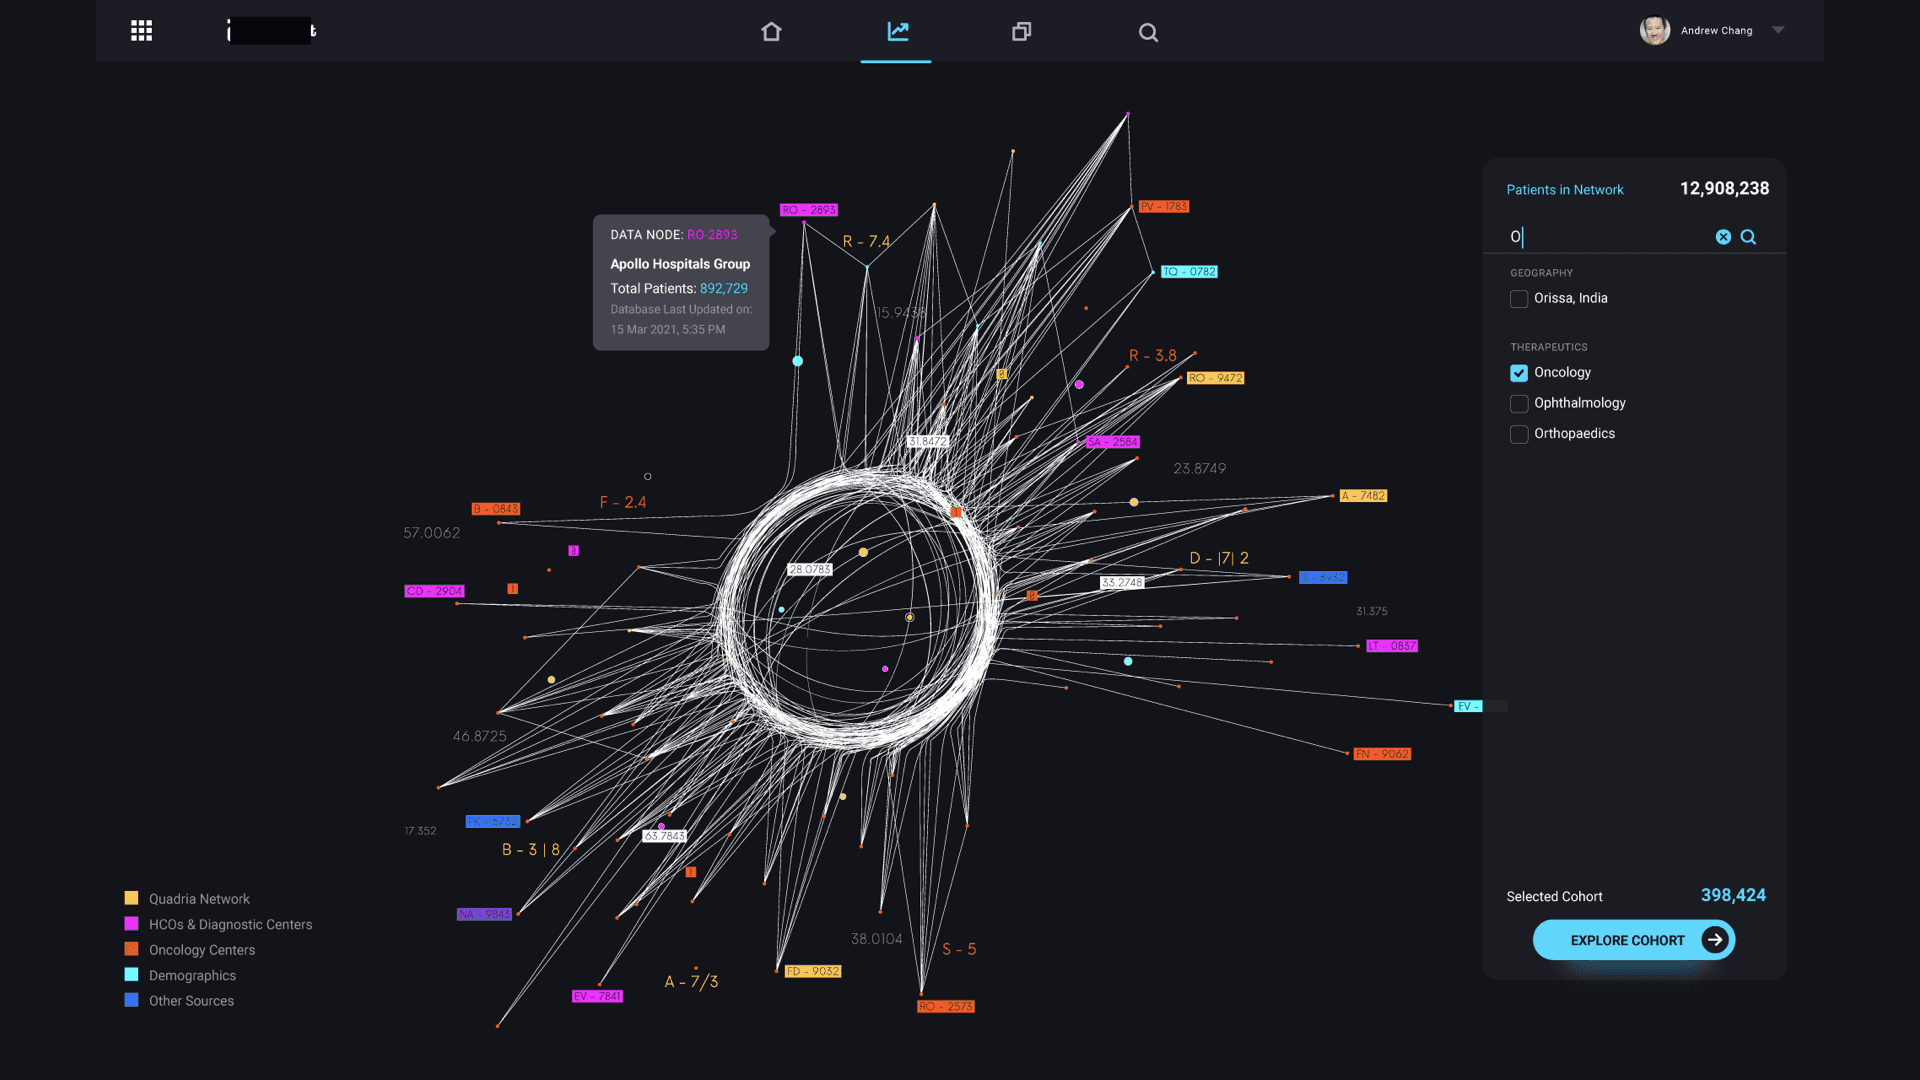
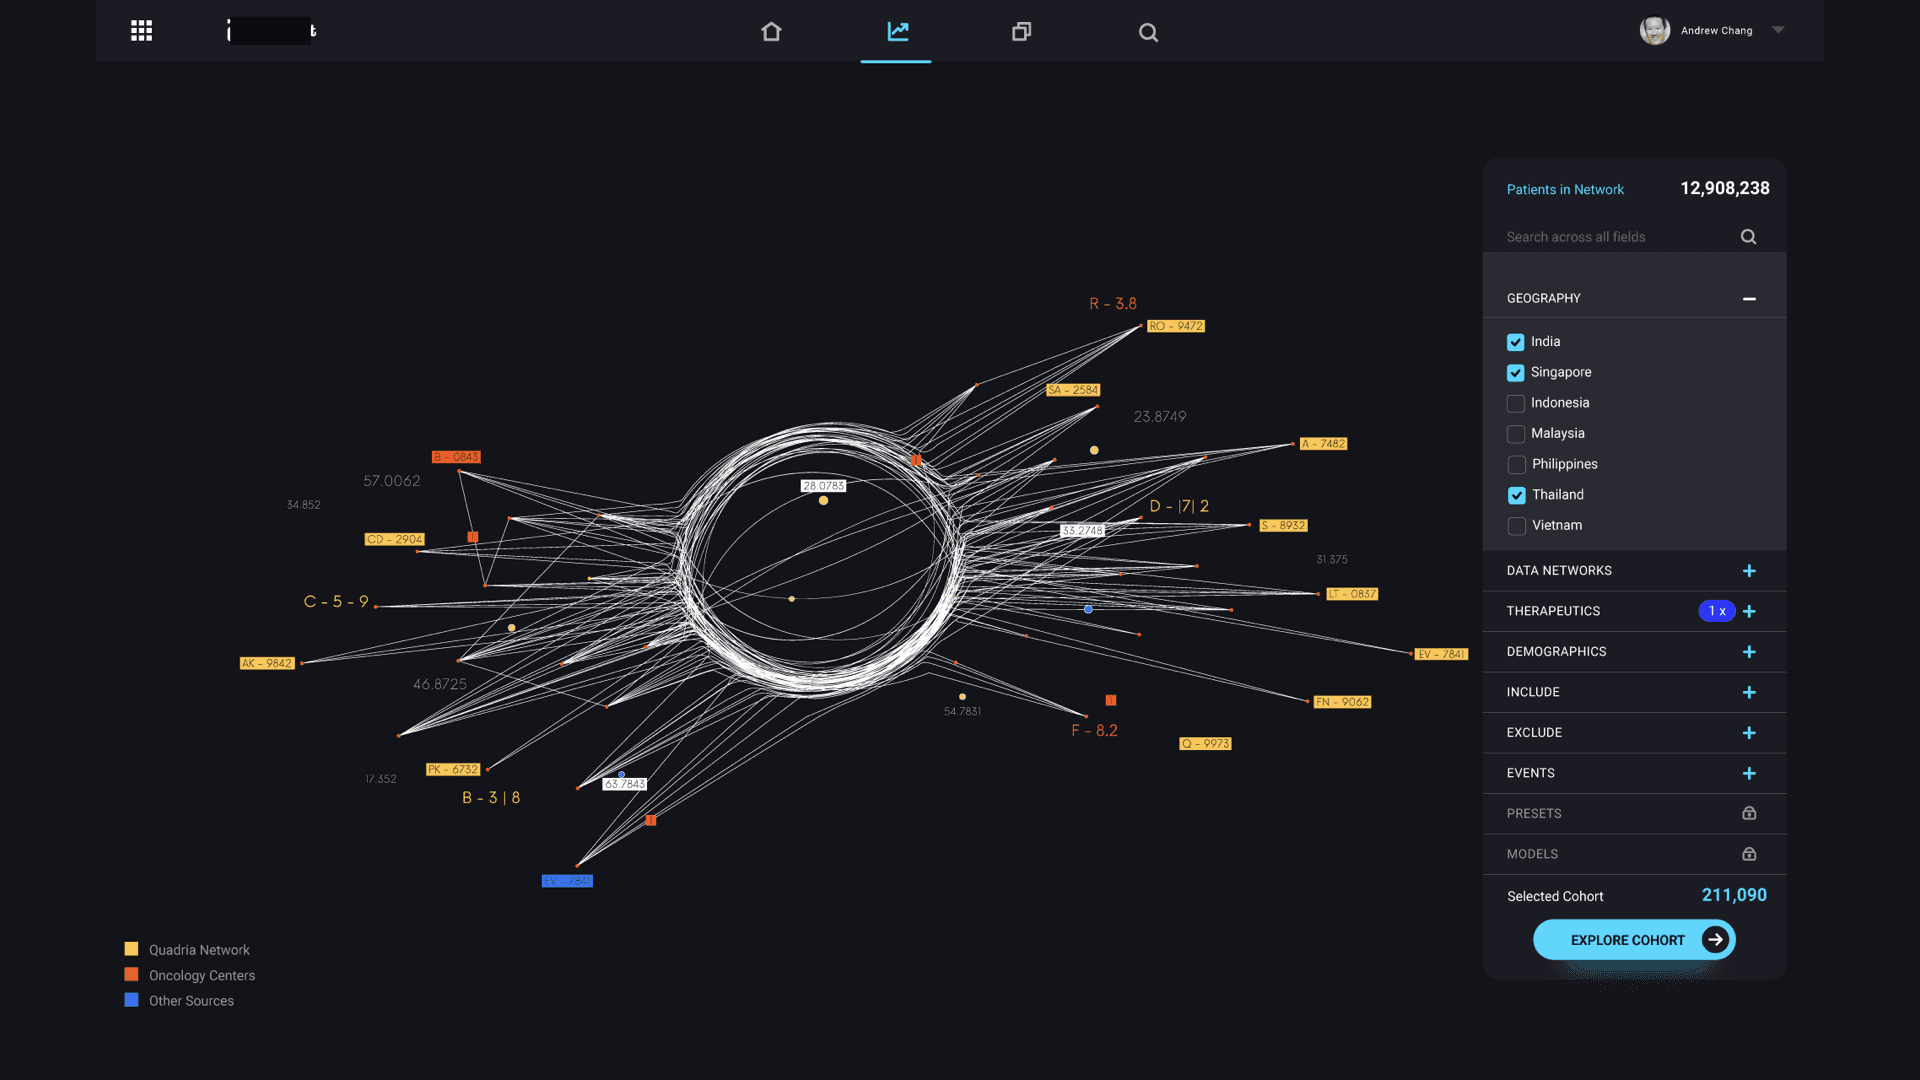
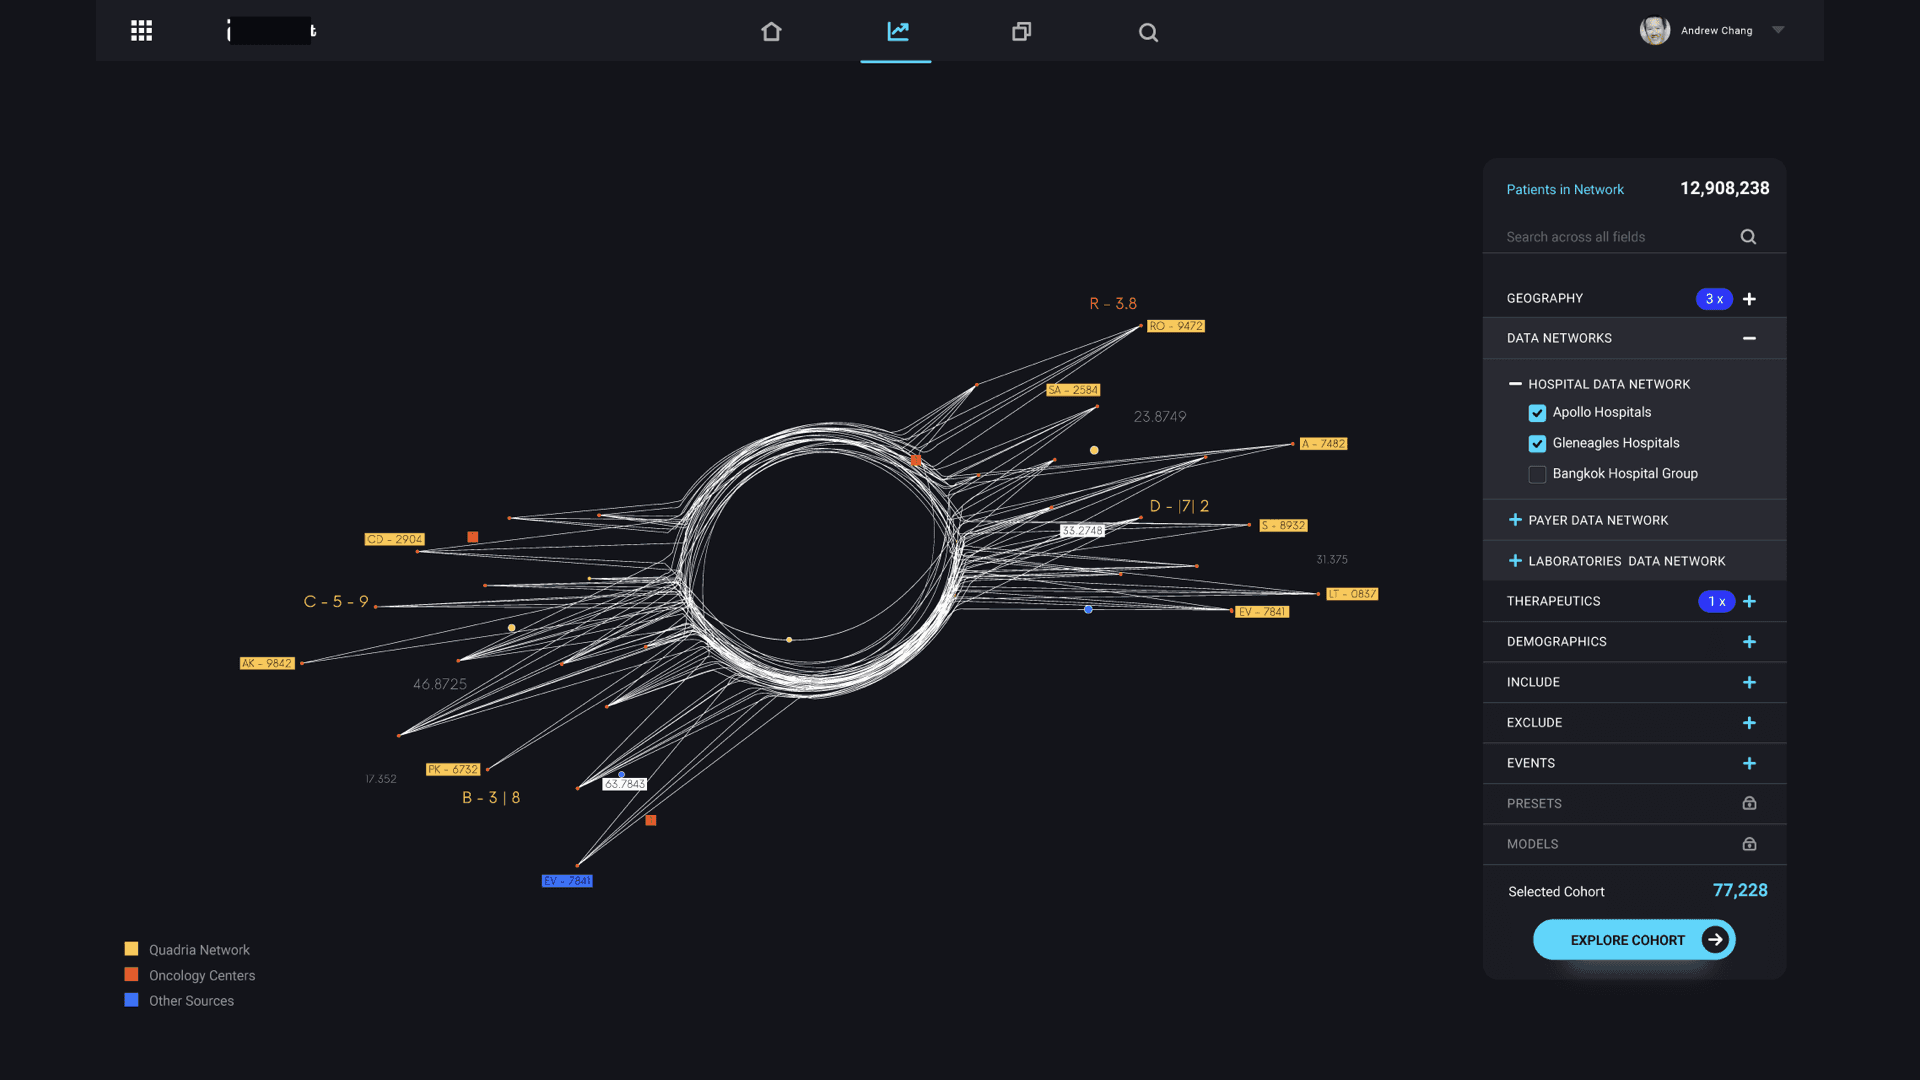
The core question that drove the design was: can we reduce a real-world event into a data model that can be simulated, understood, and optimized? The centerpiece of the design was the “data star” — a spider-web visualization that made the pharmaceutical data universe navigable. Inspired by how Uber uses maps as the fundamental interaction layer, the data star represented every dataset as a ray extending from a central hub. Rays merged into data nodes, color-coded by provenance (internal operational, internal analytical, external partnership, purchased). Users could filter by cohort, disease state, biological target, or market condition — and with each filter, the data star would morph into a digital twin of the selected population.
That transformation — from static data visualization to dynamic simulation — was the core innovation. Once you had a digital twin of a patient cohort, you could run virtual formulation tests. Predict acceptance rates. Simulate efficacy outcomes across different chemical compositions. The ML models underpinning the simulations were trained on historical trial data, giving clinical trial optimization predictions a credible foundation rather than pure speculation.
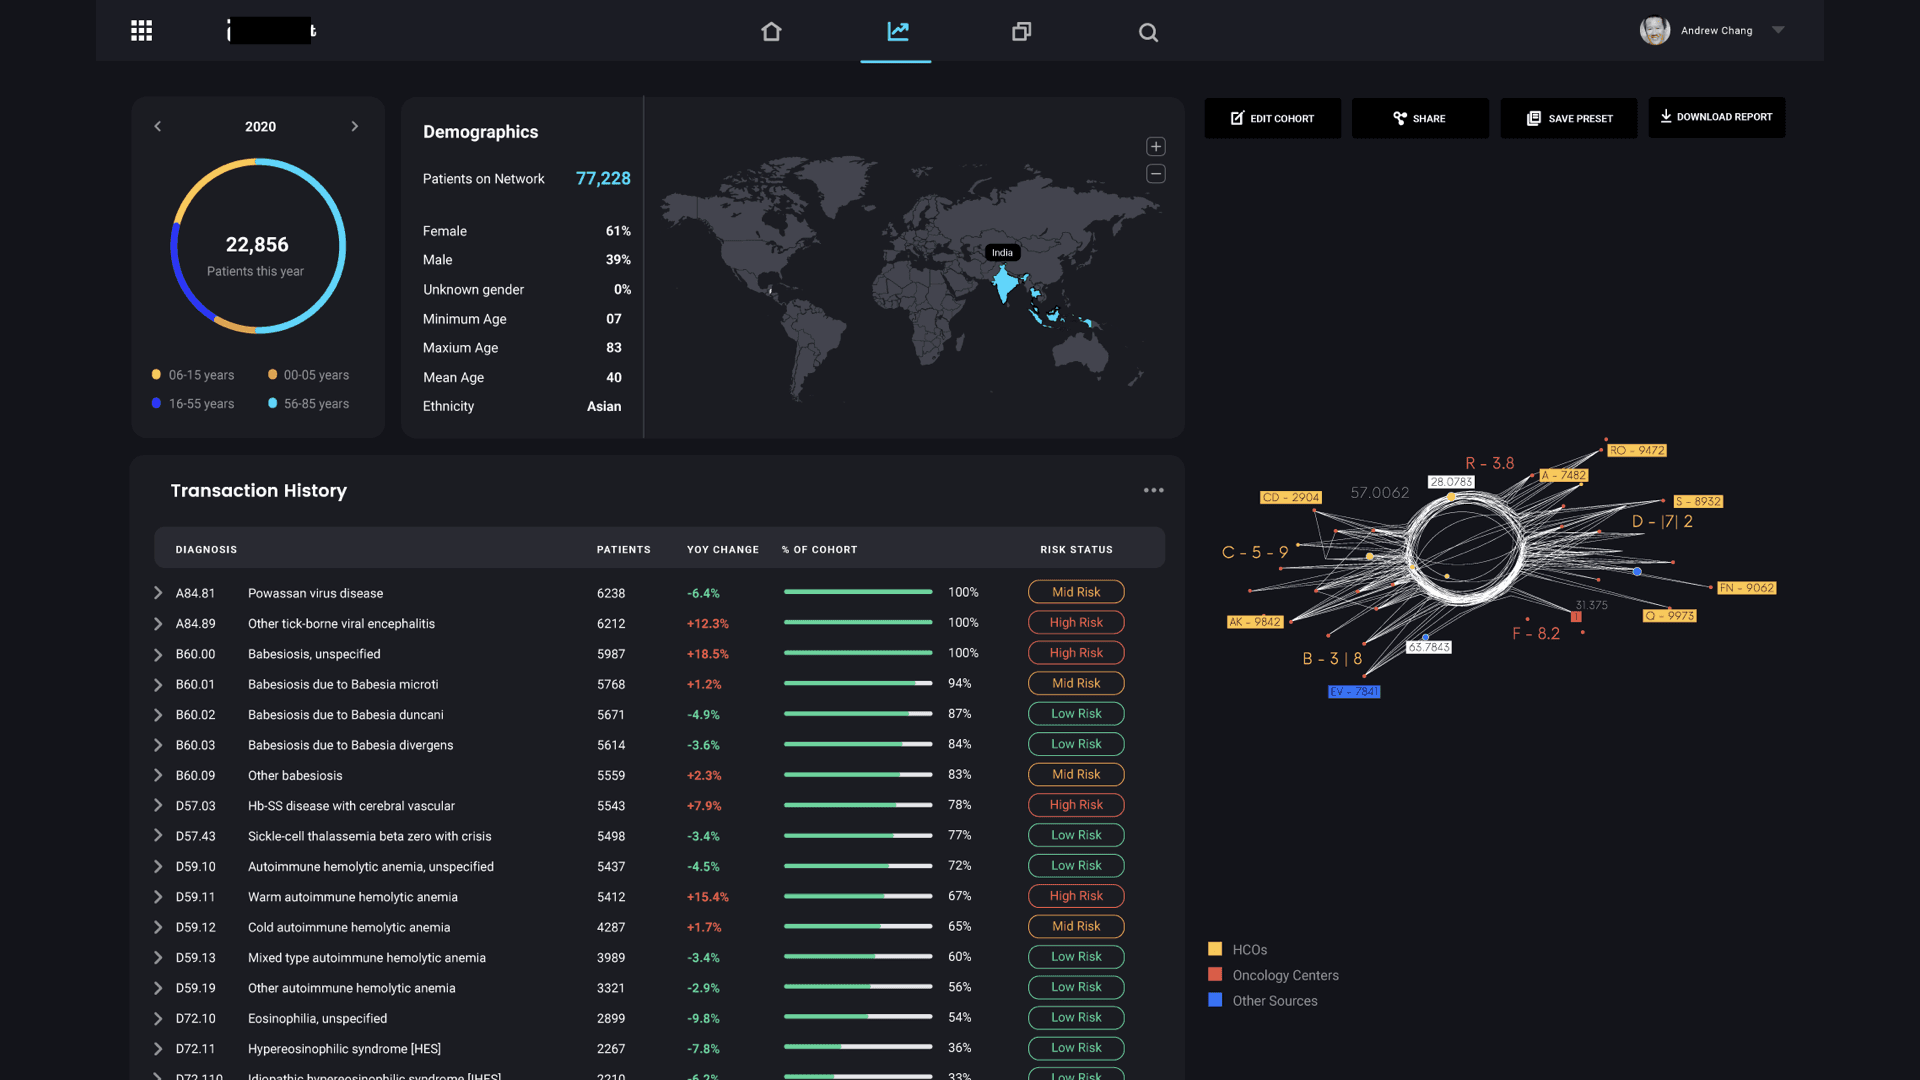
The UI balanced density with clarity. Researchers needed to see the full complexity of their data landscape while still being able to drill into specific nodes with a few clicks. We designed customizable dashboards, predictive analytics views, and workflow integration points that mapped to existing drug development stages rather than forcing a new process on teams already under pressure.
What Happened
The stakeholder pitch landed well. There was genuine excitement in the room — particularly around the data star visualization. When I walked through the interactions, showing how filtered data nodes could morph into a living simulation of a patient cohort, the response was immediate and visceral. People could see what was possible.
However, we didn’t get funded.
This was a signaling game I misread — the kind of pattern Nassim Nicholas Taleb warns about in Fooled by Randomness: mistaking noise for signal, narrative for evidence. Stakeholders signaled excitement — which I interpreted as organizational readiness. But excitement about a vision and readiness to execute are fundamentally different games. The stakeholders knew their data was messier than they let us on, but the pitch room isn’t where people reveal inconvenient truths. Nobody raises their hand in front of the CTO to say “actually, our data governance is a disaster.” I should have designed the process to surface those truths before the pitch, not after. Excitement signals are not readiness signals. Learning to distinguish between the two is one of the most expensive lessons in product strategy.
Three things killed it:
Data quality. The organization’s datasets were incomplete, inconsistent, and lacked standardization. You can’t build a credible digital twin on unreliable inputs. The metadata gaps alone meant you couldn’t trace data lineage on critical datasets — a non-starter for any system that needs to earn trust from scientists.
Data integration. The disparate sources used different schemas, proprietary formats, and legacy systems that would require substantial engineering just to harmonize. The ETL pipeline work alone would have consumed months before demonstrating any tangible value — and in a post-COVID budget environment, patience for long lead times was thin.
Organizational data maturity. This was the deepest issue and the real killer. There was no centralized data governance framework. No clear data ownership or stewardship model. Stakeholders raised legitimate concerns about who would maintain a pharmaceutical data platform that depended on continuous data curation. Without governance, any platform — no matter how well-designed — would degrade. This wasn’t a technical problem. It was an organizational one. And organizational problems don’t yield to good UI.
The Antifragile Failure
Here’s what makes this project worth writing about honestly: the failure itself was antifragile in Taleb’s sense (Antifragile). The project didn’t just fail and leave nothing behind — it failed in a way that made the organization stronger. There’s a resonance here with Hermann Hesse’s Siddhartha — the idea that wisdom can’t be transmitted, only earned through direct experience. The organization needed to confront its data gaps firsthand. No strategy deck could have substituted for that confrontation.
The process of building and presenting this drug discovery AI platform surfaced critical data quality, integration, and governance gaps that the organization hadn’t previously recognized — or at least hadn’t confronted. Before this project, data governance was an abstract concern on a roadmap somewhere. After it, those foundational issues became urgent organizational priorities with executive attention and budget.
The project failed as a funded initiative. It succeeded as a diagnostic. And in retrospect, a diagnostic was what the organization actually needed. Shipping a platform on a shaky data governance foundation would have been worse than not shipping at all — it would have created the illusion of progress while the real problems compounded underneath.
Sometimes the most valuable outcome isn’t the product. It’s the honest confrontation with prerequisites you’ve been avoiding.
What We Should Have Subtracted
Looking back, the failure map is clear — and it’s mostly about things we should have removed, not things we should have added.
Subtract the full platform ambition. The data discovery exercise was the right instinct — but we should have taken it deeper instead of pivoting to platform design. Turn the terrain map into a full data auditing and governance layer: catalog what existed, map quality gaps, build lineage tracking. Not glamorous. Not demo-worthy. But it was the actual prerequisite, and leaping past it was the original sin.
Subtract the data star visualization. This is the painful one. The data star was the most exciting element of the design — the thing that made stakeholders lean forward in their chairs. But that excitement masked the foundation problem. It was like designing a beautiful penthouse for a building with no foundation. The visualization should have come after the data was trustworthy, not before.
Subtract the grand vision pitch. We should have said no to presenting the full platform concept before the data governance foundation was proven. The grand pitch created expectations we couldn’t meet and commitments the organization wasn’t ready to resource. A smaller, uglier, honest assessment of data readiness would have been more valuable than a beautiful vision deck.
The lesson is via negativa at its sharpest: sometimes the most valuable thing is to NOT build the product, and instead build the prerequisite. Ambition without readiness is expensive theater.
Framework Failure Boundary
Thin-slicing has a failure mode — and this project found it. I thin-sliced the product but not the prerequisites.
I carved the platform vision into viable pieces: start with data ingestion, then add harmonization, then layer simulation. That sequencing was sound. What I didn’t thin-slice was the foundation beneath it all. I assumed data governance was solid enough to build on. It wasn’t. The first thin slice should have been: “Can this organization’s data even support a unified view?” — and the honest answer would have been no.
The lesson: thin-slice the foundation first. Validate the prerequisites before you validate the product. If the ground isn’t solid, the most elegant architecture is still sinking.
The Origin Story of the Data Trinity
The failure of this project is the origin story of the Data Trinity framework.
A year later, working with a German manufacturer on a different data platform challenge, I took the hard lesson from pharma — that data maturity is the prerequisite, not the outcome — and built it into a repeatable diagnostic. Where this project assumed readiness and discovered the gap too late, the Data Trinity was designed to diagnose readiness first. Data governance. Data quality. Data integration. Three pillars that must be assessed and addressed before any ambitious data product gets built.
The Data Trinity exists because this project failed. Every framework worth using has a failure behind it. This was mine.
What I’d Do Differently Today
The drug discovery AI landscape has shifted dramatically since 2021 — something I’ve written about in The AI Productivity Trap and The Three Waves of AI. LLMs and AI agents now handle much of what we were proposing as custom-built capabilities — unstructured data parsing, schema harmonization, intelligent data classification. What would have required months of custom NLP pipeline work can now be achieved with foundation models and fine-tuning in weeks.
More importantly, the data governance tooling ecosystem has matured. Data catalogs, lineage tracking, and automated quality monitoring are now off-the-shelf rather than build-from-scratch. If I were approaching this pharmaceutical data platform problem today, I’d flip the sequence entirely: start with a lightweight data governance layer (using existing tools), demonstrate data quality improvements on a single pipeline, then layer the digital twin concept on a foundation that’s already proven trustworthy. Build trust before building ambition.
And I’d design the discovery process to surface organizational readiness gaps before the pitch room — not after. Run the diagnostic first. Let the findings earn the mandate. Skip the theater.
Key Takeaway
The best product vision in the world fails if the organization isn’t ready for it. Technical feasibility is necessary but insufficient — organizational data maturity, data governance readiness, and institutional trust in the data are the actual prerequisites. Diagnosing that gap honestly is sometimes more valuable than shipping the product. And if you’re lucky, the failure teaches you something worth building into a framework.
FAQ
What is a digital twin in the context of drug discovery?
A digital twin is a virtual model of a real-world system — in this case, a simulated representation of a patient cohort or market segment. By feeding it real clinical and demographic data, you can run virtual experiments (like testing drug formulation responses) without physical trials. It doesn’t replace clinical trials, but it can dramatically reduce which formulations make it to that expensive stage — compressing clinical trial optimization timelines from years to months.
Why didn’t the project get funded if stakeholders were excited?
Excitement about vision and confidence in execution readiness are different things — a signaling game that’s easy to misread. The stakeholders could see the potential, but the foundational data quality, integration, and governance gaps created a risk profile that exceeded the organization’s appetite — particularly in a post-COVID budget environment. The prerequisites for the pharmaceutical data platform simply weren’t in place yet. The pitch room rewards bold vision; the budget room rewards proven foundations.
How does the “data star” visualization differ from a standard dashboard?
Most dashboards present pre-aggregated views of known metrics. The data star is an exploration interface — it lets researchers navigate the full landscape of available datasets, see provenance and relationships between data sources, and dynamically construct the specific data view they need. It’s closer to a map than a report. The key interaction is filtering and morphing: as you apply constraints (disease state, cohort, biological target), the visualization transforms from a data overview into a focused digital twin simulation.
What is organizational readiness and why does it matter for AI products?
Organizational readiness is the gap between what a technology can do and what an organization can actually support. For drug discovery AI and pharmaceutical data platforms, it includes data governance maturity, data quality standards, clear ownership models, and institutional trust in the underlying data. Many ambitious AI projects fail not because the technology isn’t ready, but because the organization isn’t. This project is a case study in exactly that failure mode.